Aptos’ APT drops as token tracks broader crypto market weakness
News
Video
Consensus 2026
Data & Indices
By Will Canny, CD Analytics|Edited by Stephen Alpher
Dec 24, 2025, 1:51 p.m.

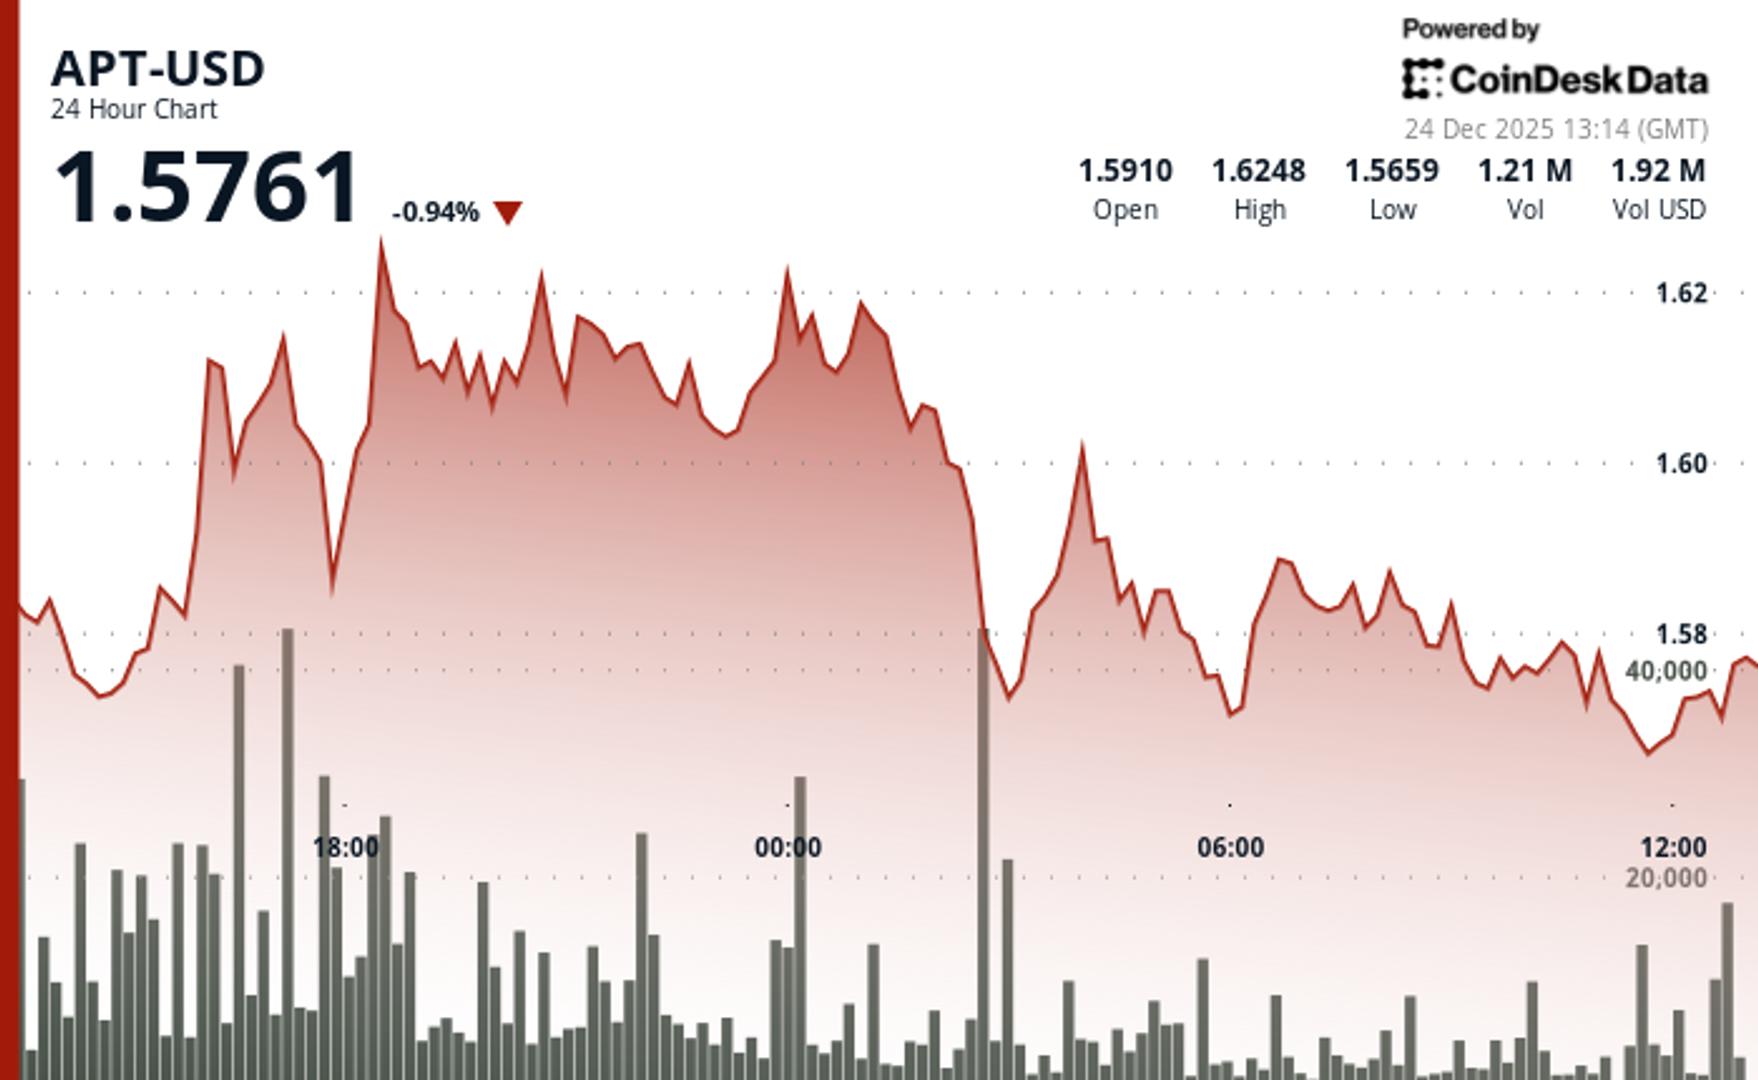
- Aptos’ APT slipped 1% to $1.56 on Wednesday.
- Trading activity fell 11% under the 30-day average amid holiday market conditions.
APT slipped 1% to $1.56 over the last 24 hours, as wider crypto markets also retreated. The CoinDesk 20 index was 0.6% lower at publication time.
The token traded between $1.62-$1.56 during the 24-hour period, establishing a $0.06 range representing 3.6% intraday volatility, according to CoinDesk Research’s technical analysis model.
STORY CONTINUES BELOW
The model showed a battle between bulls and bears at $1.63 resistance during evening hours.
Support held firm near $1.56 as momentum faded into thin holiday trading, according to the model.
Volume spiked 71% above the 24-hour average to 4.69 million tokens, coinciding with selling pressure from the session peak of $1.62, the model said.
The token completed a double-bottom formation at $1.52 support before rallying through $1.56 resistance.
- Primary resistance holds firm at $1.66 through multiple tests while support consolidates near $1.56
- 11% drop in volume versus 30-day metrics signals trader fatigue, though selective spikes above 46,000 tokens reveal pockets of accumulation interest
- Double-bottom structure at $1.52 support triggers recent rally attempt, creating potential launch pad for moves above $1.56 resistance
- Upside breakout targets $1.58-$1.585 resistance cluster while breakdown below $1.56 support opens path to $1.52 retest levels
Disclaimer: Parts of this article were generated with the assistance from AI tools and reviewed by our editorial team to ensure accuracy and adherence to our standards. For more information, see CoinDesk’s full AI Policy.
More For You
Dec 19, 2025

L1 tokens broadly underperformed in 2025 despite a backdrop of regulatory and institutional wins. Explore the key trends defining ten major blockchains below.
What to know:
2025 was defined by a stark divergence: structural progress collided with stagnant price action. Institutional milestones were reached and TVL increased across most major ecosystems, yet the majority of large-cap Layer-1 tokens finished the year with negative or flat returns.
This report analyzes the structural decoupling between network usage and token performance. We examine 10 major blockchain ecosystems, exploring protocol versus application revenues, key ecosystem narratives, mechanics driving institutional adoption, and the trends to watch as we head into 2026.
More For You
By James Van Straten|Edited by Sheldon Reback
1 hour ago

Measured against U.S. money supply, gold is back at levels that marked major historical peaks, while bitcoin retraces toward a key cycle floor.
What to know:
- Gold is challenging a resistance zone against the U.S. money supply that was last seen in 2011 and the early 1970s, and only broken decisively during the late 1970s surge.
- Against the same measure, bitcoin, known to some as digital gold, is testing support near the April “tariff tantrum” low that also marks prior cycle high from March 2024.


Back to menu
Prices
Back to menu
Back to menu
IndicesBack to menu
Research
Back to menu
Consensus 2026Back to menu
Back to menu
Back to menu
Webinars
Select Language
Sign In Read more onCoinDesk: Bitcoin, Ethereum, Crypto News and Price Data | Read More